

Comparing urban and suburban neighborhoods by the numbers
It’s been well-established in recent years that downtowns and urban neighborhoods generate tremendous value per acre for communities. In retrospect, this should be fairly obvious: as land is more efficiently used, it will provide substantial net revenue over the expenses of servicing and maintenance. Most developers have known this all along, and fortunately there’s a growing roster of local governments that are doing the math and coming to the same conclusion.
As part of the Downtown Savannah 2033 master plan, we established the immense value created within a relatively small percentage of land in the city. Today, I want to take this analysis a bit further and compare one of the neighborhoods in the downtown plan study area to a fairly typical in-town suburban neighborhood. This is not an attempt to judge anyone’s lifestyle choice (more on that later); rather, I think it’s instructive to get a deeper understanding of how local government revenues and expenses can be analyzed neighborhood by neighborhood. Given the many fiscal challenges that communities all over the country face, this is an example of a first step that anyone can take.

Location of the two neighborhoods in Savannah
For this fairly quick analysis, I wanted to compare neighborhoods of roughly the same size in Savannah. As it turns out, they are almost identical. The suburban area, which is an amalgam of Kensington Park and Fairway Oaks (KP) is compared to the urban example of Thomas Square (which itself is a combination of Thomas Square and Metropolitan). The former is a very solid middle-class neighborhood, well-liked in the area with comfortable, ranch-style homes and quiet, tree-lined streets. As a parent of two little kids, it’s the kind of place that gives me yard envy. Thomas Square is very typical of streetcar-era neighborhoods of the late 19th and early 20th centuries. It has a wide variety of types of homes, apartments, shops, offices, churches and civic buildings. Kensington Park has held its value relatively well since its original development about fifty years ago, likely due to a central location, tree-lined streets and well-maintained homes. Thomas Square has had all of the ups and downs typical of neighborhoods of its age. It thrived and developed quickly up until the Great Depression, and then suffered the plight of gradual abandonment all through the suburban era. In recent years, it’s experienced a strong resurgence of interest and is now redeveloping rapidly. Typical images of both neighborhoods are below:
Kensington Park / Fairway Oaks:
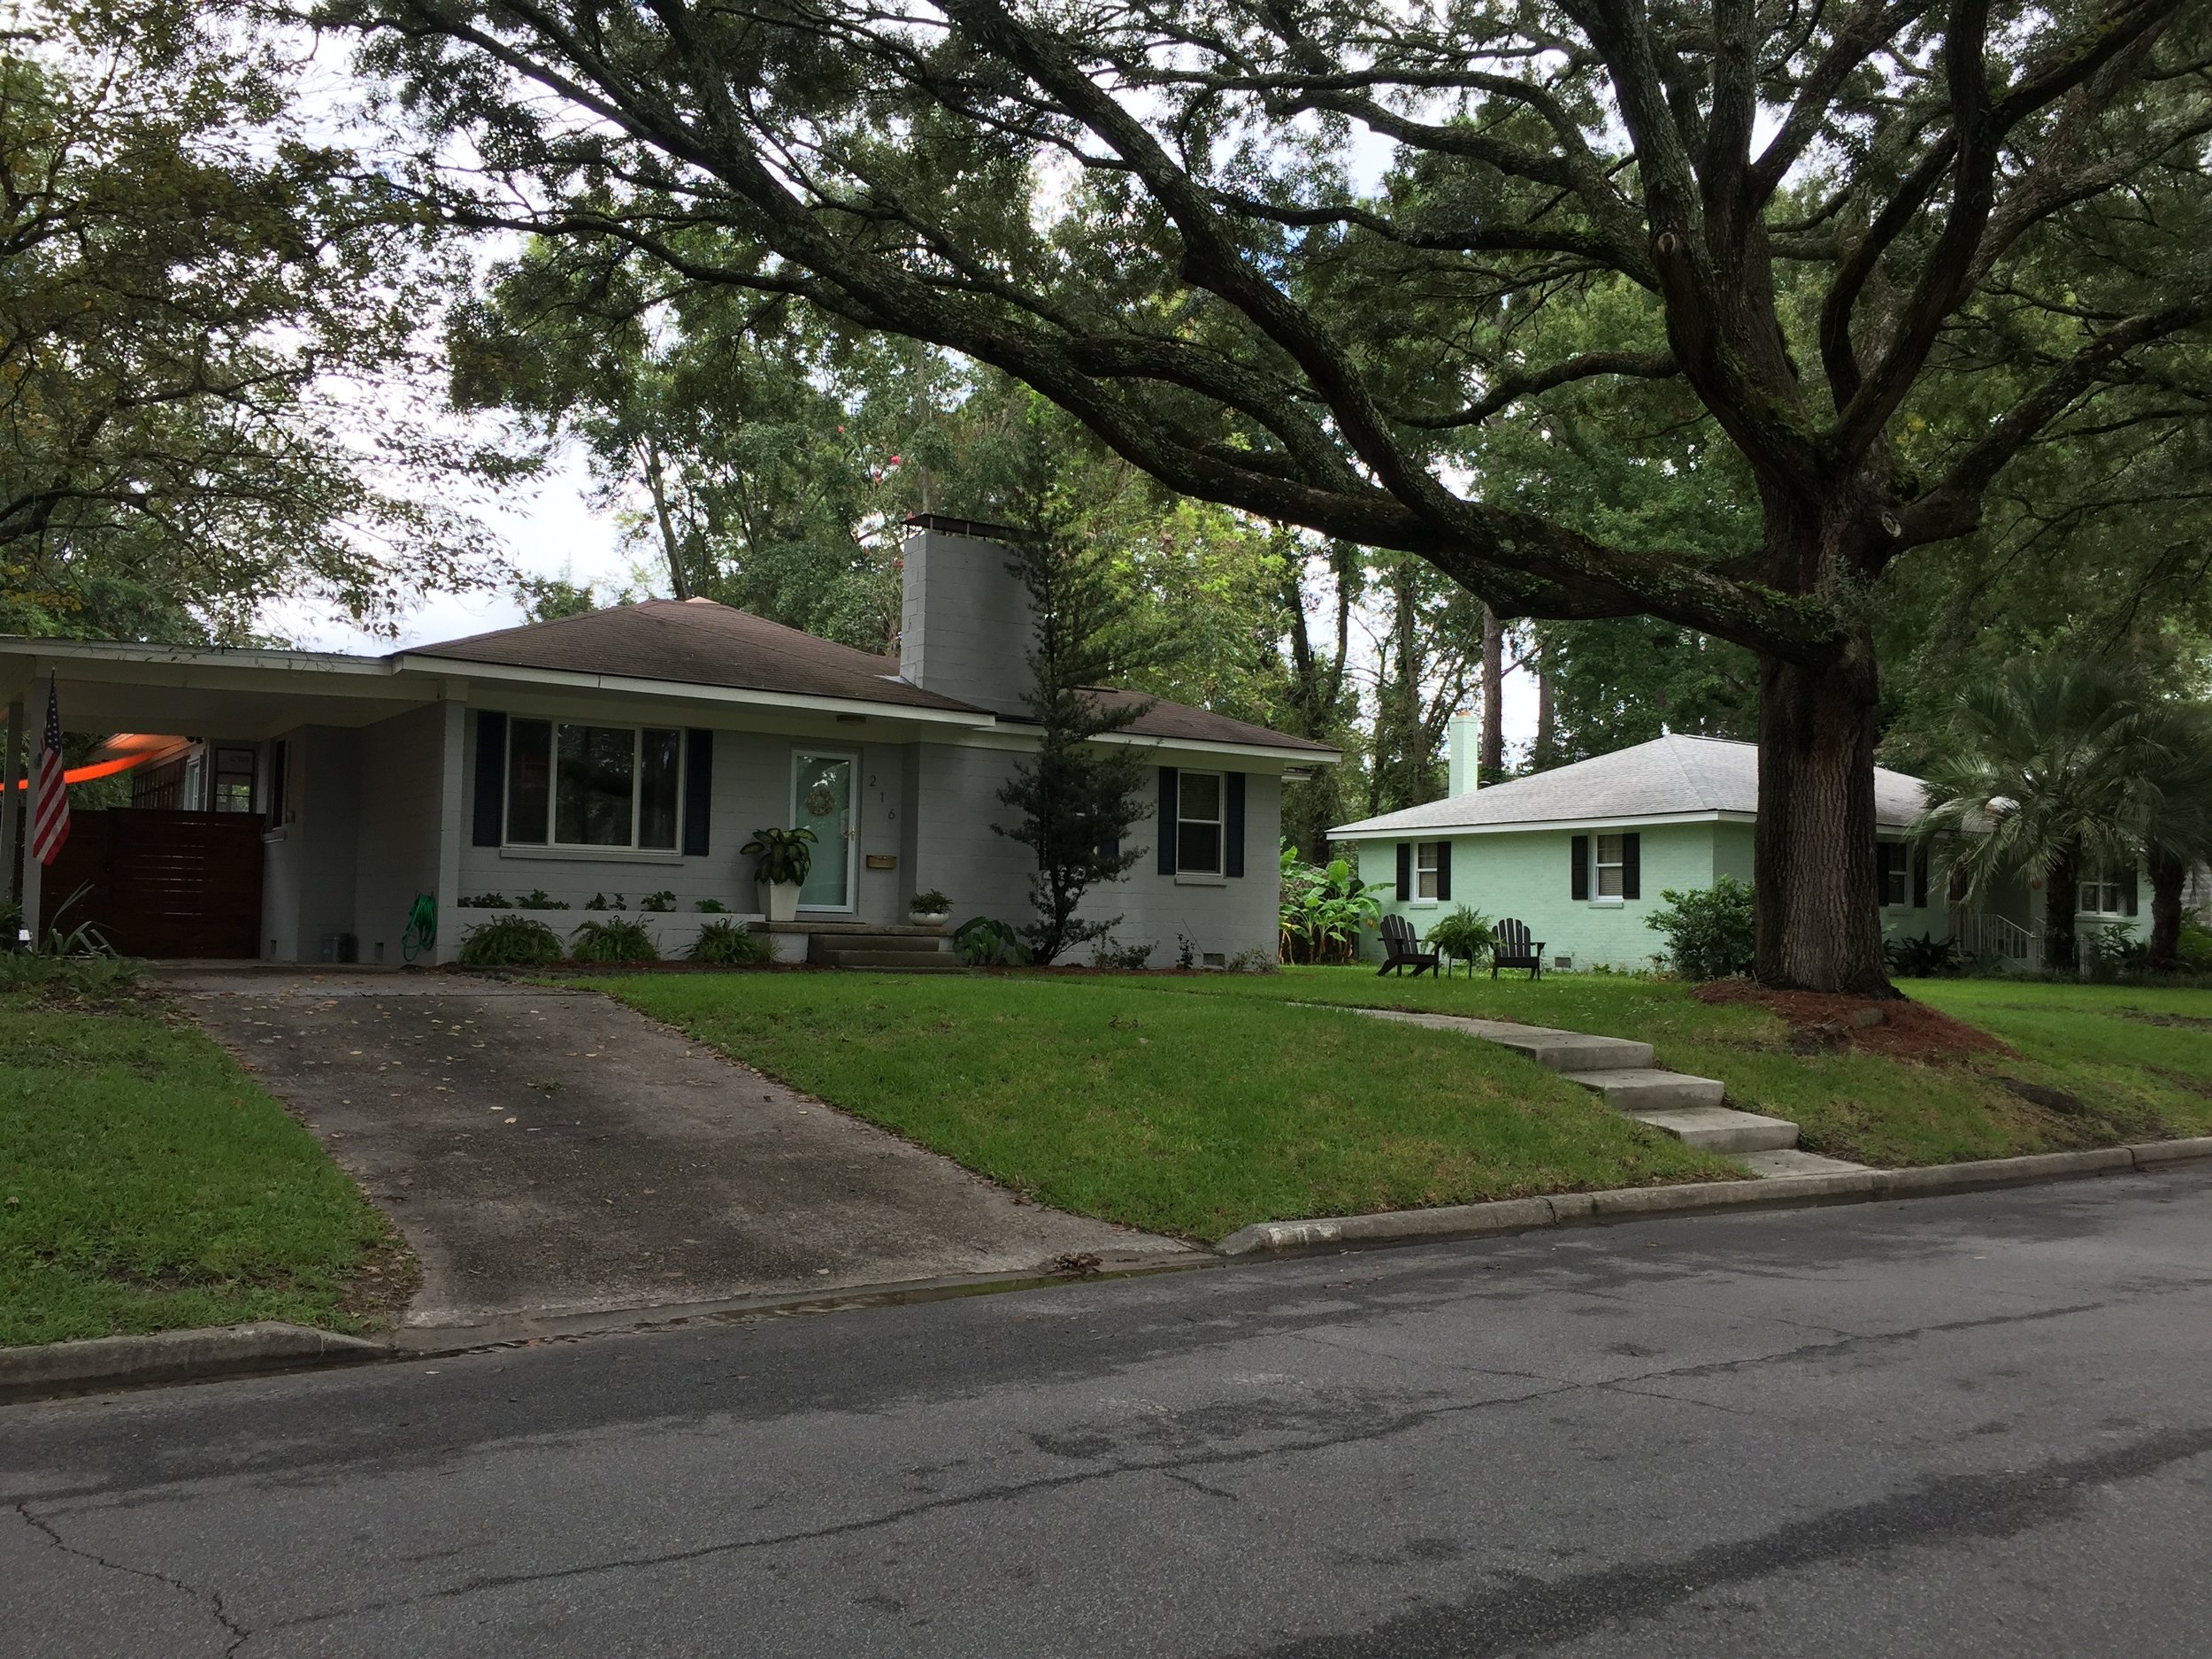


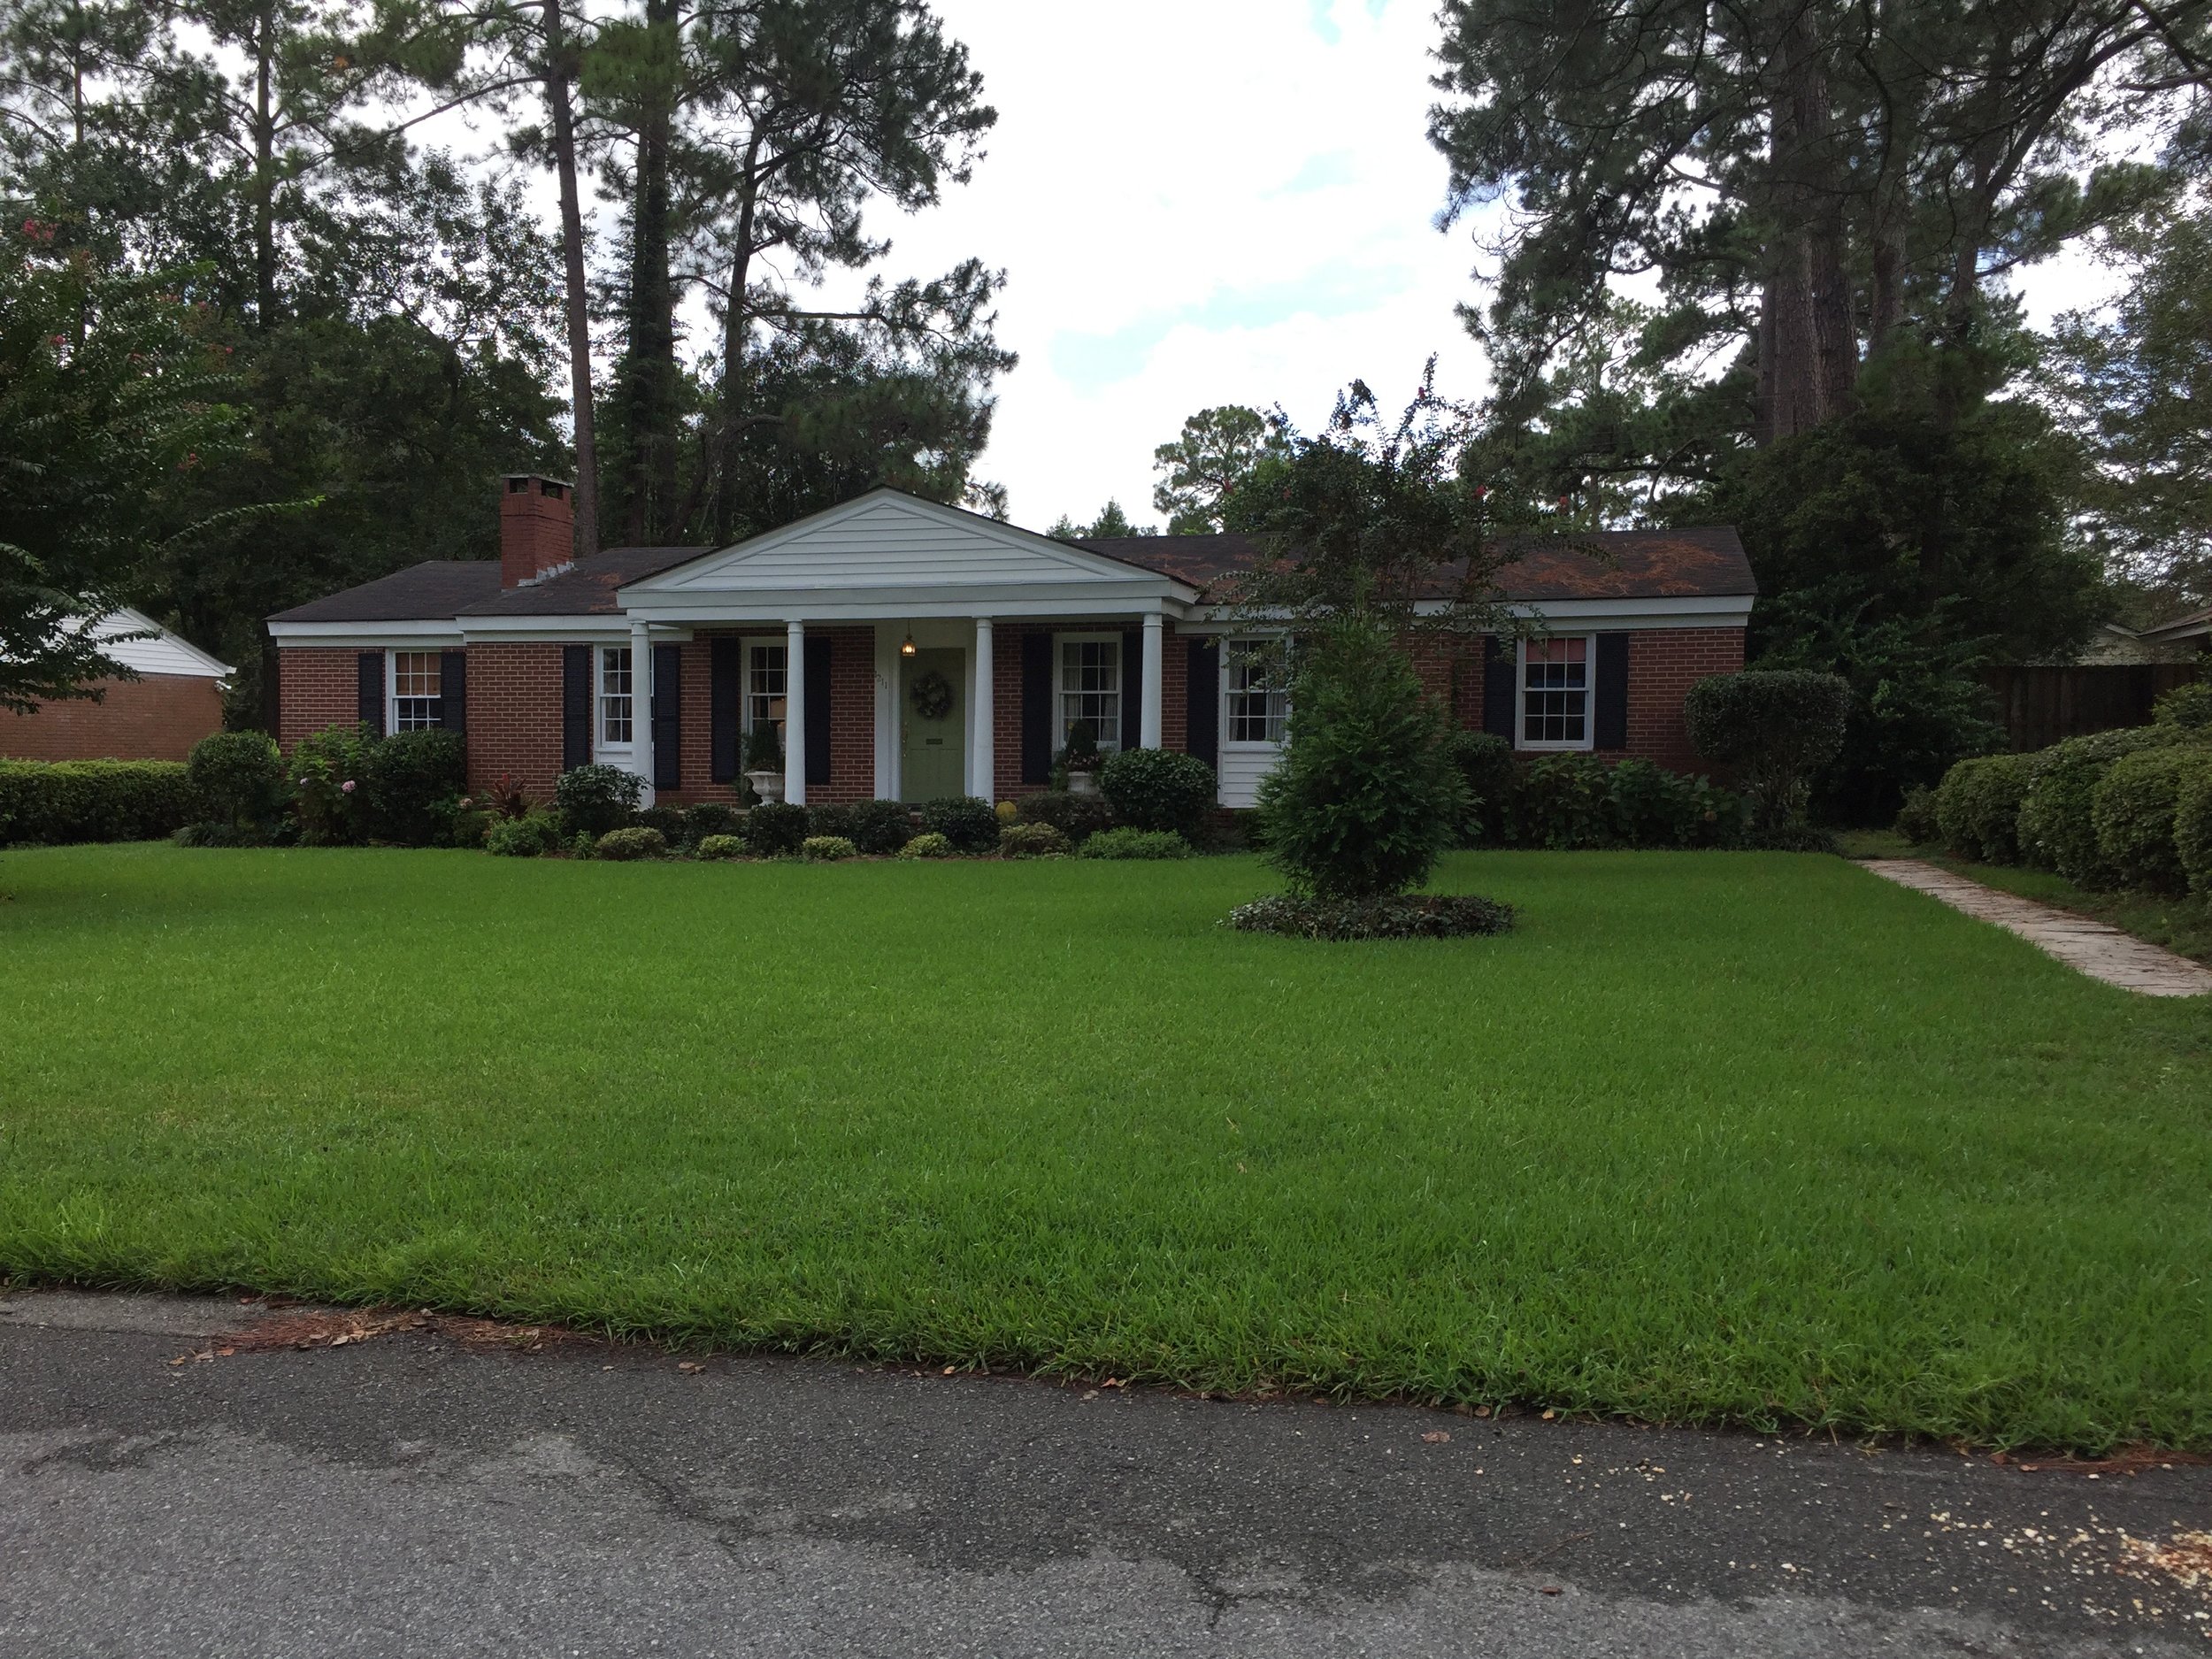


Thomas Square:


I won’t bury the lede any further. Three many takeaways came out of this analysis, all of which I cover in some detail below:
- The Thomas Square development pattern definitely provides a bigger bang fiscally even when under-performing the regional average on demographics. And – it’s a big bang for all of the various taxing jurisdictions.
- The Thomas Square pattern provides more opportunity for individual and family wealth-creation, in two ways: 1) more opportunities for small businesses to own their own real estate b) a wide variety of house hacking options. One could claim that this makes the pattern more equitable, and better for local economies.
- The Kensington Park pattern works fine fiscally if the housing values remain high.
I’d be remiss if I didn’t say that this is an extraordinarily difficult task. Frankly, it requires hundreds of hours of analysis and a team of professionals to wade through all of the local data and come to bullet-proof conclusions. What I’ve done is to comb through GIS and census data, combine it with some field research and then take a look at local government budgets for benchmarks.
I’m also not attempting to pick on the local Savannah taxing jurisdictions. I’m doing this to illustrate a point: we need to all better understand the math of our own communities: how and where value is created, how and where it’s spent, and what it all means for planning the future. If we don’t dive deep into the math, then we are not being responsible stewards for current and future generations. The planning of our cities and our infrastructure directly impacts our local government’s ability to provide the services that we desire, and maintain or improve what we have.
In this case, the work reveals a premium of somewhere between 20-30% for the Thomas Square development pattern, which is likely even higher when the total roster of local taxes is factored in. Within the city of Savannah, this impacts all three taxing jurisdictions: the City, the County and the Board of Education. Neither of the latter entities pays for the infrastructure in these neighborhoods, nor the basic services that most residents expect. The County obviously provides many services, including the court system, the library system, county parks and recreation, emergency management and indigent care. The Board of Education is a county-wide public school system. Its funding comes from property taxes primarily, but is supplemented by a special sales tax for school construction and state and federal monies. However, it is the City that has the primary responsibility in these neighborhoods for infrastructure, for policing, sanitation and basic services. Clearly anything that assists the City in its ability to provide services more efficiently is a big deal.
That said…the other taxing jurisdictions clearly also benefit from the increased population and efficiency of the Thomas Square pattern. In fact, both could make a claim that their own operational efficiency would be enhanced with a more compact pattern of development that required less driving. The Board of Education could benefit tremendously, since they spend a large sum of money annually on transportation for students. Less need for busing equals more money that can be spent on educators and students.
So what are the numbers, exactly? Below is a table comparing the two neighborhoods with some key data points.

In order to calculate the 20-30% premium, I did the following:
- Thomas Square has 1.83 times the linear miles of streets over Kensington Park, plus rear lanes (alleys for you not in the South). The lanes are typically not improved nor maintained, but they do exist. The linear miles of streets essentially correlate to the amount of water lines and sewer lines.
- Thomas Square generates 2.36 times more assessed value, and pays 2.27 times more property tax
- Putting those together, you get a net of about 30% more revenue relative to expense. I rounded down to 20% due to the lanes and the more complicated nature of compact neighborhoods vs suburban neighborhoods. I recognize that that is a bit of a WAG.
- However, those number don’t include sales tax nor lodging tax, which are also substantially higher in Thomas Square than Kensington Park. More on this topic below, but this is how I come to a premium of 20-30%
While there’s a wealth of nuance that could be explored here, I want to explore a few points.
- An item that’s not to be overlooked is the median household income in the two neighborhoods. Thomas Square still has a fairly sizable amount of land this is quite depressed from a real estate perspective. The income numbers reflect this reality, although it is certainly changing. The median household income for Chatham County is north of $53,000, so there’s a significant shortfall in this area. Still, the values and revenues produced are impressive. Imagine what those values would be if the neighborhood simply had the median income for the region? Kensington Park is much closer to the median, which indicates its status as a solid, middle-class neighborhood. That analysis can reveal two things: first, that when the suburban pattern is populated by people at or above the median income, the revenues likely work pretty well compared to expenses. But when they slip down the economic ladder, it’s very challenging to provide city services and maintain the infrastructure. Second, that the urban pattern of Thomas Square, can still generate sufficient revenue even when household incomes sit far below the median.
- There’s one other number not shown on the chart that interested me: the number of businesses in each neighborhood, and the separate parcels that can be owned by businesses. Thomas Square, being of the mixed-use, streetcar era of development is replete with businesses and shops on streets throughout the neighborhood. I will delve into this analysis deeper in another post, but my scan revealed 164 parcels/buildings that were purpose-built for commercial or mixed-use, housing around 245 businesses. In Kensington Park, there are two parcels - an outparcel along a major arterial, and a neighborhood strip center housing a grocery store and about a dozen other businesses. What this means for wealth creation cannot be understated. The opportunity for a business or a small developer to own income-producing property is exponentially better in one pattern over the other. That means more local people (generally) owning property, and more local people benefiting from the economy. That’s no small matter. Stay tuned for more on this.
- The final area has to do with the nuances of taxes in Georgia and in Chatham County. The above numbers all pertain to property tax solely. Sales tax in Georgia is very strictly limited by the State. In Chatham County, we have a 7% sales tax rate. Of that, 4% goes directly to State government. 1% goes to the Board of Education for school construction (voter-approved), and another 2% are local option sales taxes (voter-approved) that essentially help to fund a variety of City and County projects. Much of that is infrastructure, but not all of it. Sales tax data is not as easily available as property tax, so I did not pull it for this analysis. There’s no doubt, though that there’d be a stark difference between the two areas given the relative amount of business activity. One other source of revenue is lodging tax. In a city like Savannah, with a large and active hotel and vacation rental market, lodging tax is significant. This tax is an additional 6% on top of the sales tax. The 6% is (somewhat strangely) spelled out in state legislation as to where it specifically goes, but the lion’s share going to the City’s general fund. Again, in this analysis, the Thomas Square neighborhood allows for vacation rentals and inns (and their associated revenue) while the Kensington Park neighborhood does not.
This type of analysis can be quite exhausting when you get fully into the details. I know I’m exhausted after researching and writing this, and you might be exhausted after reading it. These are tough chores, requiring serious work, spreadsheets and reading glasses. But it’s an important step, and enlightening. I encourage anyone with the time to do this type of exercise as well. It's a tremendous lesson city planning and infrastructure.
A word on lifestyle choice. Many of my fellow urban-loving friends and colleagues would add to this post a summary of all that is wrong with suburbia. Heck, when I was 25, I would’ve done the same. In fact, I did do the same on many occasions. As I’ve grown older, I’ve come to a different place in my work and thoughts when it comes to the whole urban vs suburban vs rural battles that we routinely love to fight.
I don't mind some people wanting a lifestyle different than what I want. It's a big world, and I wish we could all live and let live a little more. Actually, a lot more. The truth is, at this particular moment in my own life, I might even prefer the Kensington Park pattern. With two little kids, I completely get the appeal. The neighborhood pool is something we would use routinely if we lived in the area. The quiet streets are large yards feel calming. But my heart and soul is with the urban lifestyle, and always has been. It suits me well. My family also enjoys it, and we enjoy seeing the neighborhood improve to come closer to its potential.
We enjoy a lifestyle that allows us to walk to many routine pleasures – great parks, playgrounds, local businesses and more. It’s something we do daily, and our oldest daughter has fast become an eager walker. The walking experience itself, to be honest, could be much safer and better. The streets all have cars that move far too fast, and we have precious little safe bicycle infrastructure. When other people see this and experience it, I don’t blame them for worrying about traffic. I certainly don’t blame anyone for wanting quiet cul-de-sacs where the kids can roam around safely (at least when they are little), or a large yard that’s easy to supervise. Our lifestyle requires constant monitoring of the kids when they leave the front door, and our back yard doesn’t allow much play area. We like it; I’m not complaining. But if you visit other countries and see how they’ve designed and built urban life to be better for everyone (families included), you get an idea of what we could be doing in American cities and neighborhoods. At its root, we simply need to stop prioritizing commuting traffic by cars. So I don’t blame anyone for making lifestyle choices that I wouldn’t make, in the reality of life in American cities in 2018. But I also will keep working to make our own daily experience better.
The real quandary for our cities, though, is financial. When we put all of our tax money into the same pot, taxed at the same rates regardless of efficiency or productivity, it does lead to lifestyle subsidies. That I don't like. Our communities deserve to have better services; better physical improvements, better cleanliness, more community policing and more facilities for kids and families. But all of this costs money. It has to come from somewhere. Very few of us really want to pay more out of our own pockets for taxes. We need to be much more realistic about how revenue is generated and how to generate more for the things we want. It may mean that we encourage more urbanization in some places in order to add value, and less services or cheaper infrastructure in others so that the cost burden decreases. Your mileage may vary. In any case, we need to continue to do the math, ask hard questions, and then act to make improvements. In the coming weeks, I’ll share some more thoughts on how to tackle this challenge, in urban and suburban neighborhoods.
If you got value from this post, please consider the following:
- Sign up for my email list
- Like The Messy City Facebook Page
- Follow me on Twitter
- Invite or refer me to come speak
- Check out my urban design services page
- Tell a friend or colleague about this site

